The Cost of Inequality

Visualizing the funding gap between Black and White students

By Sharon Lurye

In the United States, local property taxes provide much of the funding for public schools. But this creates an inherent disparity: the wealthier the neighborhood, the more property is worth, and the more funding its schools get.

Because property values tend to be lower in predominantly Black neighborhoods than in White neighborhoods, predominantly Black schools often get less funding. That leads to disparities like these:

A map of the Northeast region of the United States. There is a blue circle over Virginia. The size of the circle represents the size of the property tax revenue gap between Black and White students in that state. Virginia has a revenue gap of $1,294. A map of the Northeast region of the United States. There are blue circles over Virginia and Maryland. The size of the circles represents the size of the property tax revenue gap between Black and White students in that state. Virginia has the smaller circle, representing a gap of $1,294. Maryland has a gap of $2,173. A map of the Northeast region of the United States. There are blue circles over Virginia, Maryland, and Connecticut. The size of the circles represents the size of the property tax revenue gap between Black and White students in that state. Virginia has the smallest circle, representing a gap of $1,294. Maryland has a gap of $2,173. Connecticut has the largest circle, representing a gap of $4,295. A map of the Northeast region of the United States. There are green circles over Virginia, Maryland, and Connecticut. The size of the circles represents the size of the property tax revenue gap between Black and White students in that state, minus state aid. Virginia has the smallest circle, representing a gap of $1,016. Maryland has a gap of $1,497. Connecticut has the largest circle, representing a gap of $1,574. In Connecticut, the funding gap between Black and White students increased significantly from $586 in 2008 to $1,574 in 2018. A table which shows data for three dates: Maryland, Virginia, and Connecticut. The columns show the state, the property tax gap between Black and White students in that state, how much state aid makes up for that gap, and the funding gap that remains. The remaining gap in 2018 was $1,497 for Maryland, $1,016 for Virginia, and $1,574 for Connecticut.

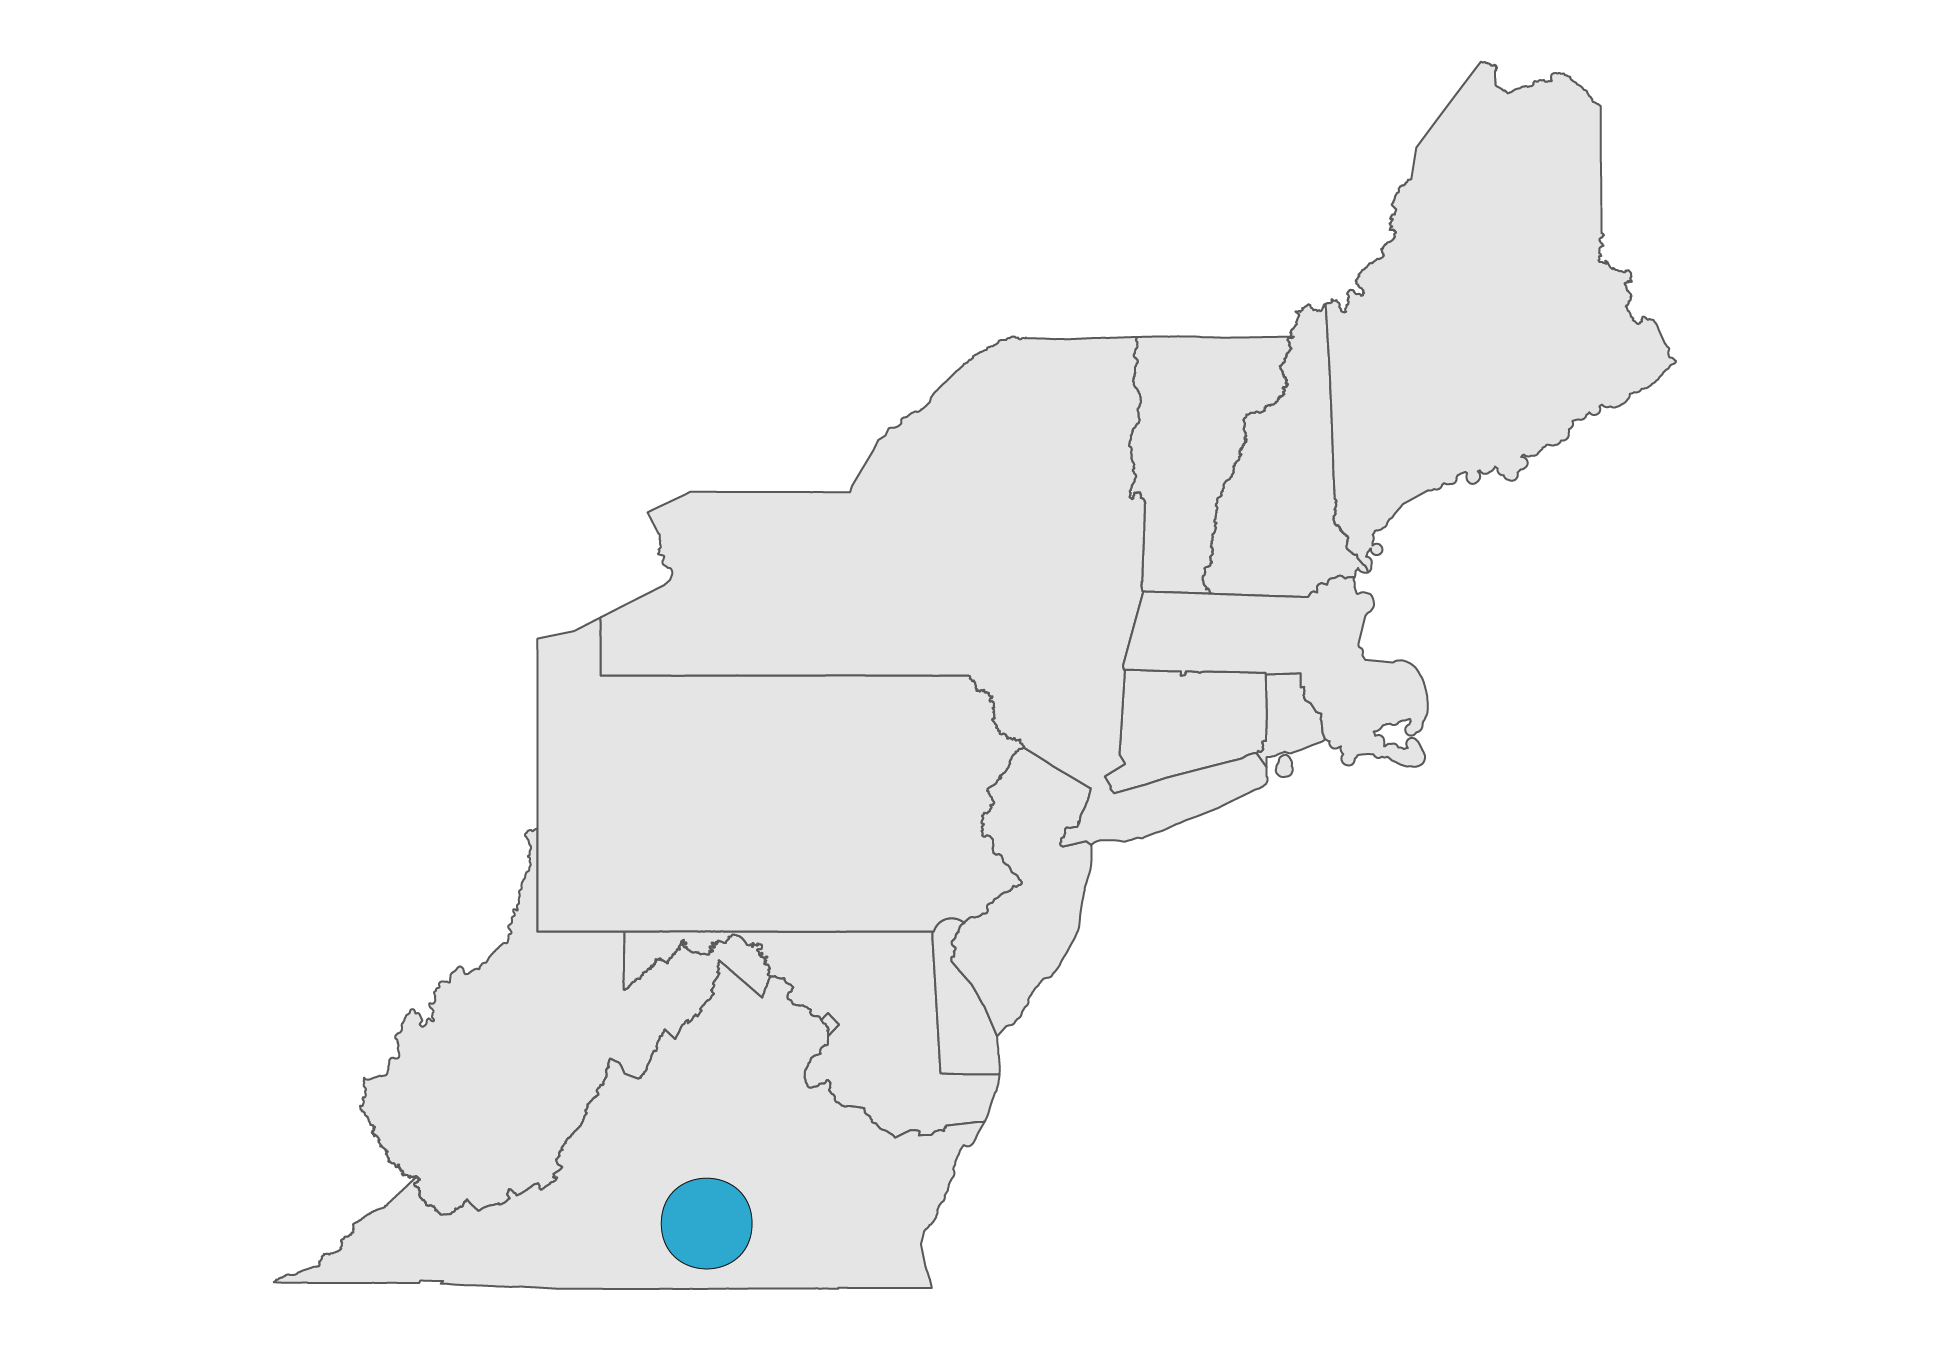
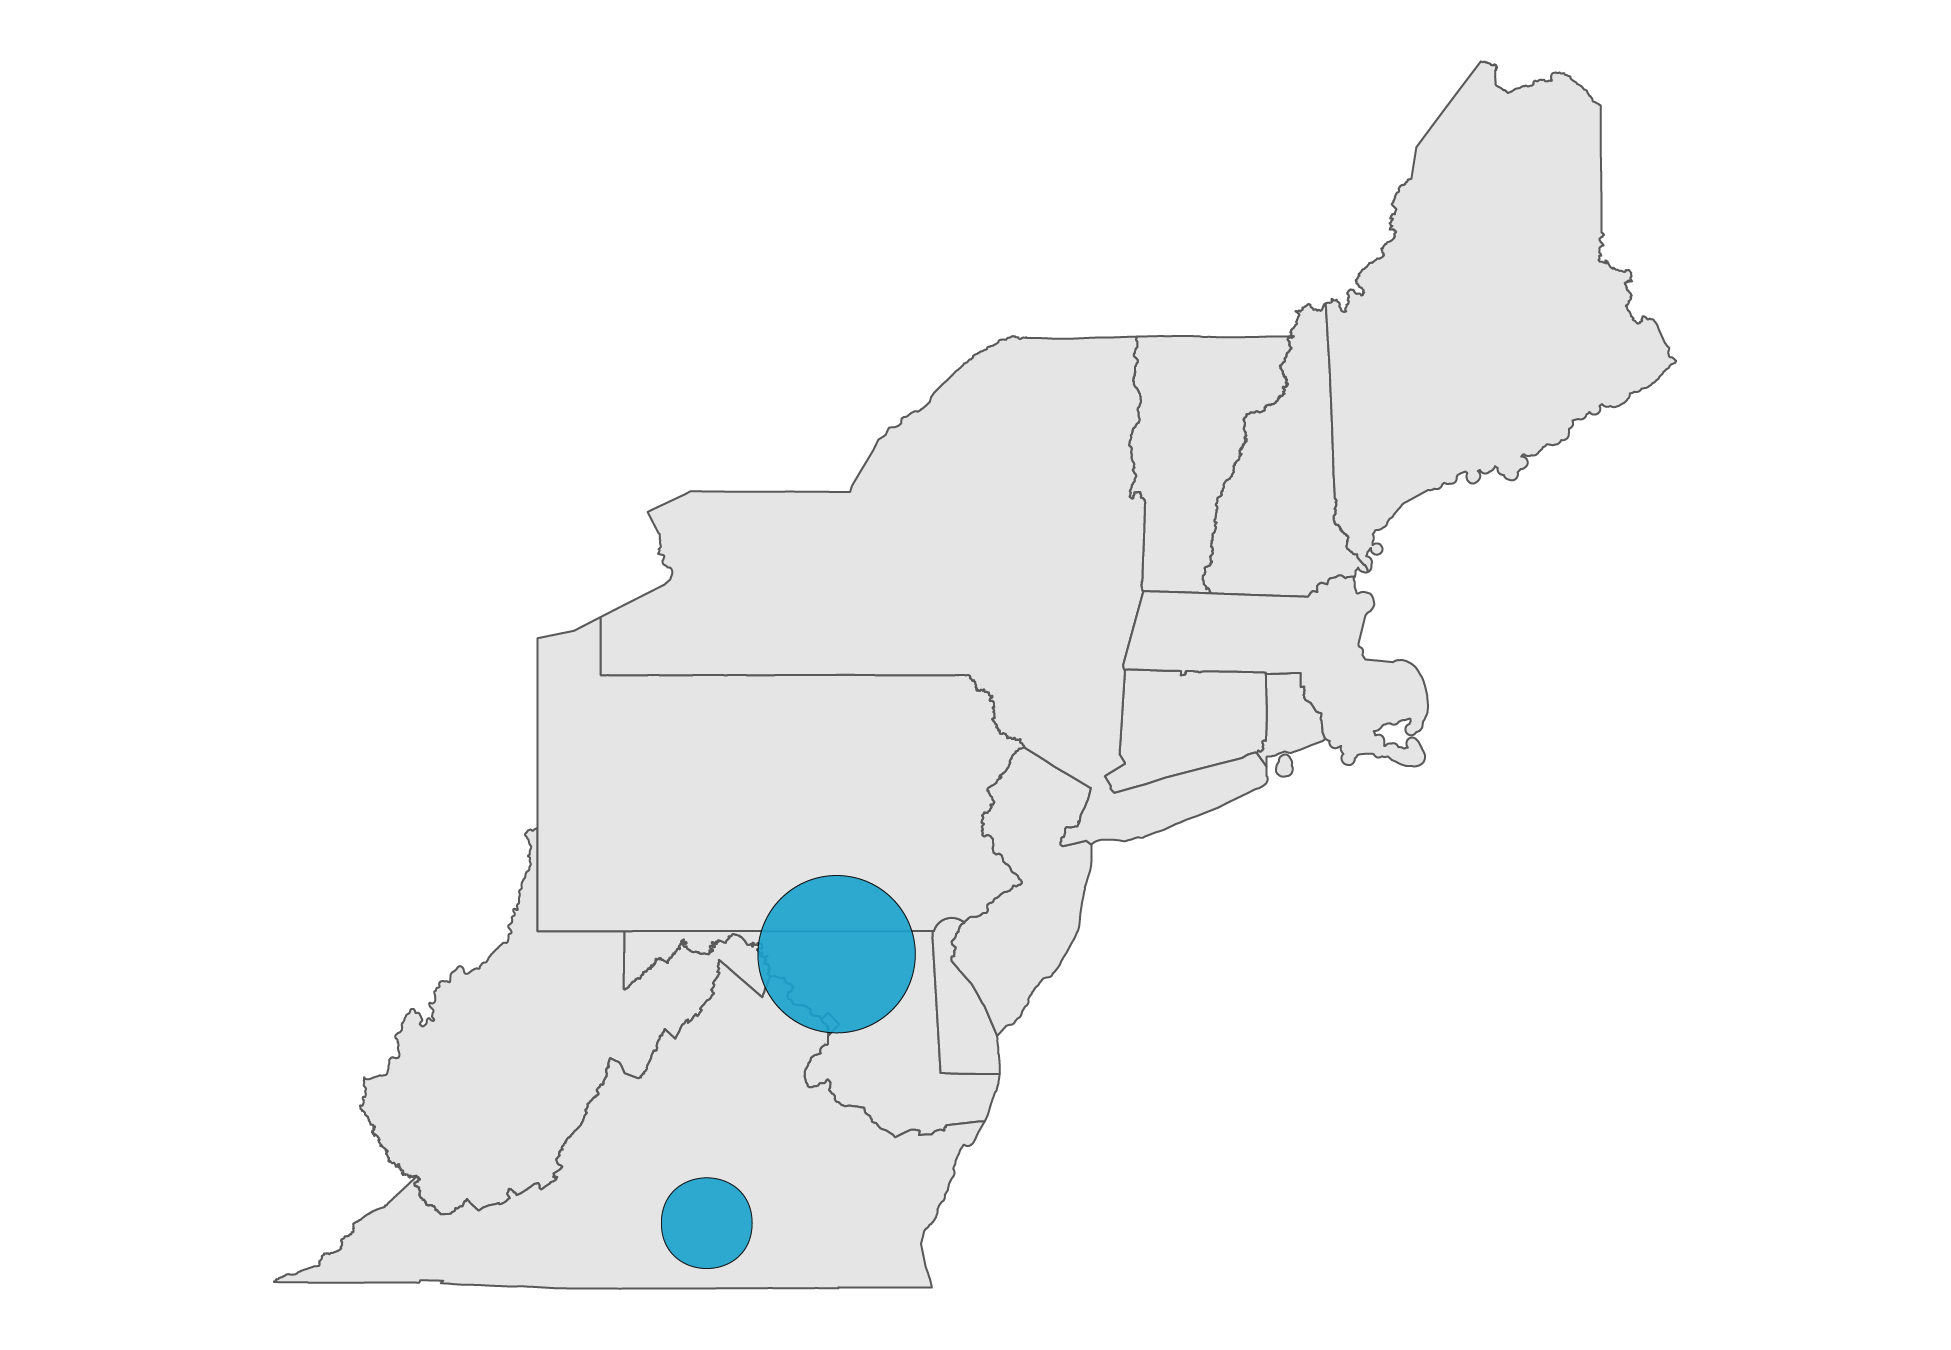
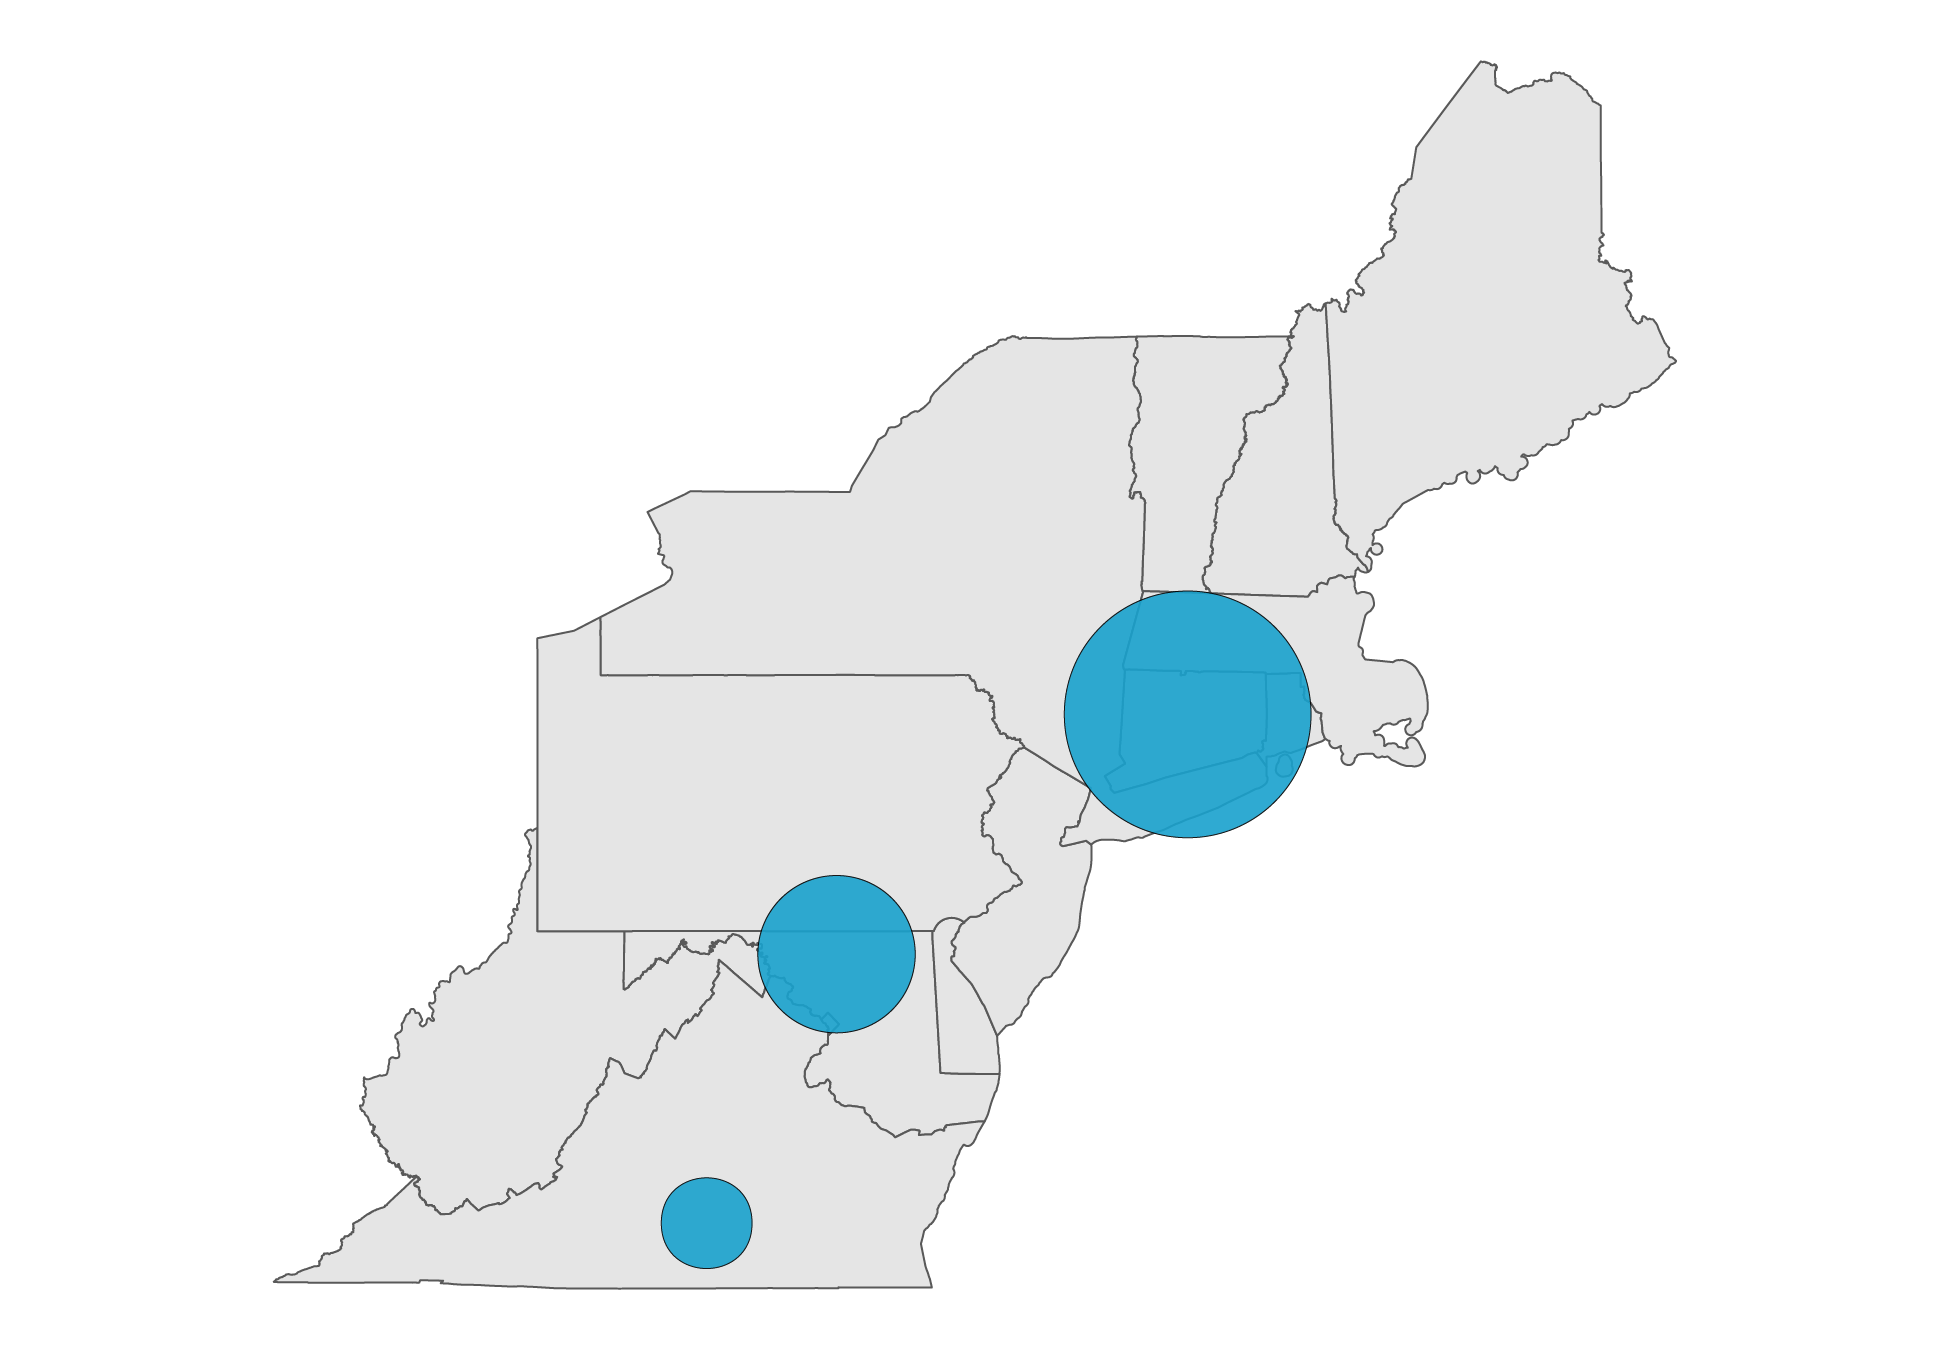
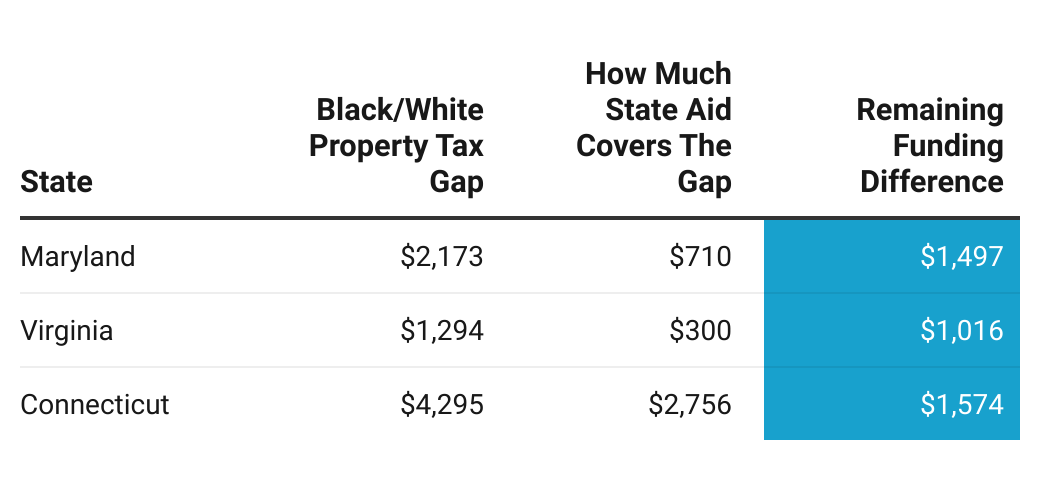
In Virginia in 2018, the average property tax revenue per child was $1,016 more for White children than for Black children.

In Maryland, White children got $1,497 more in property taxes to fund their education.

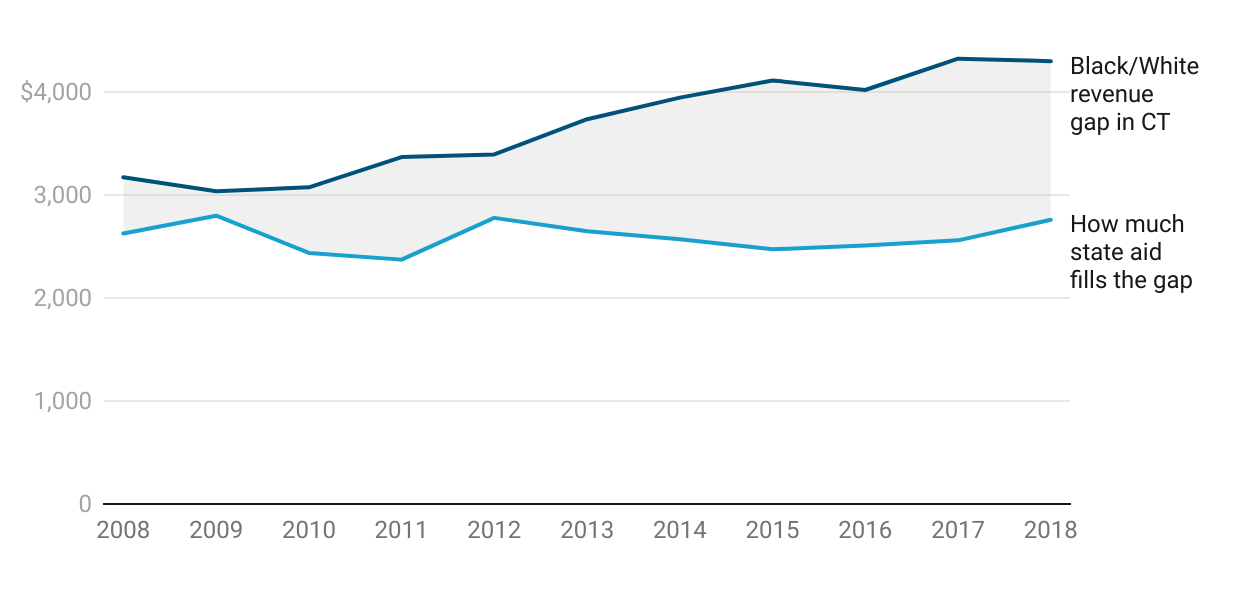
In Connecticut, White children got $4,295 more.

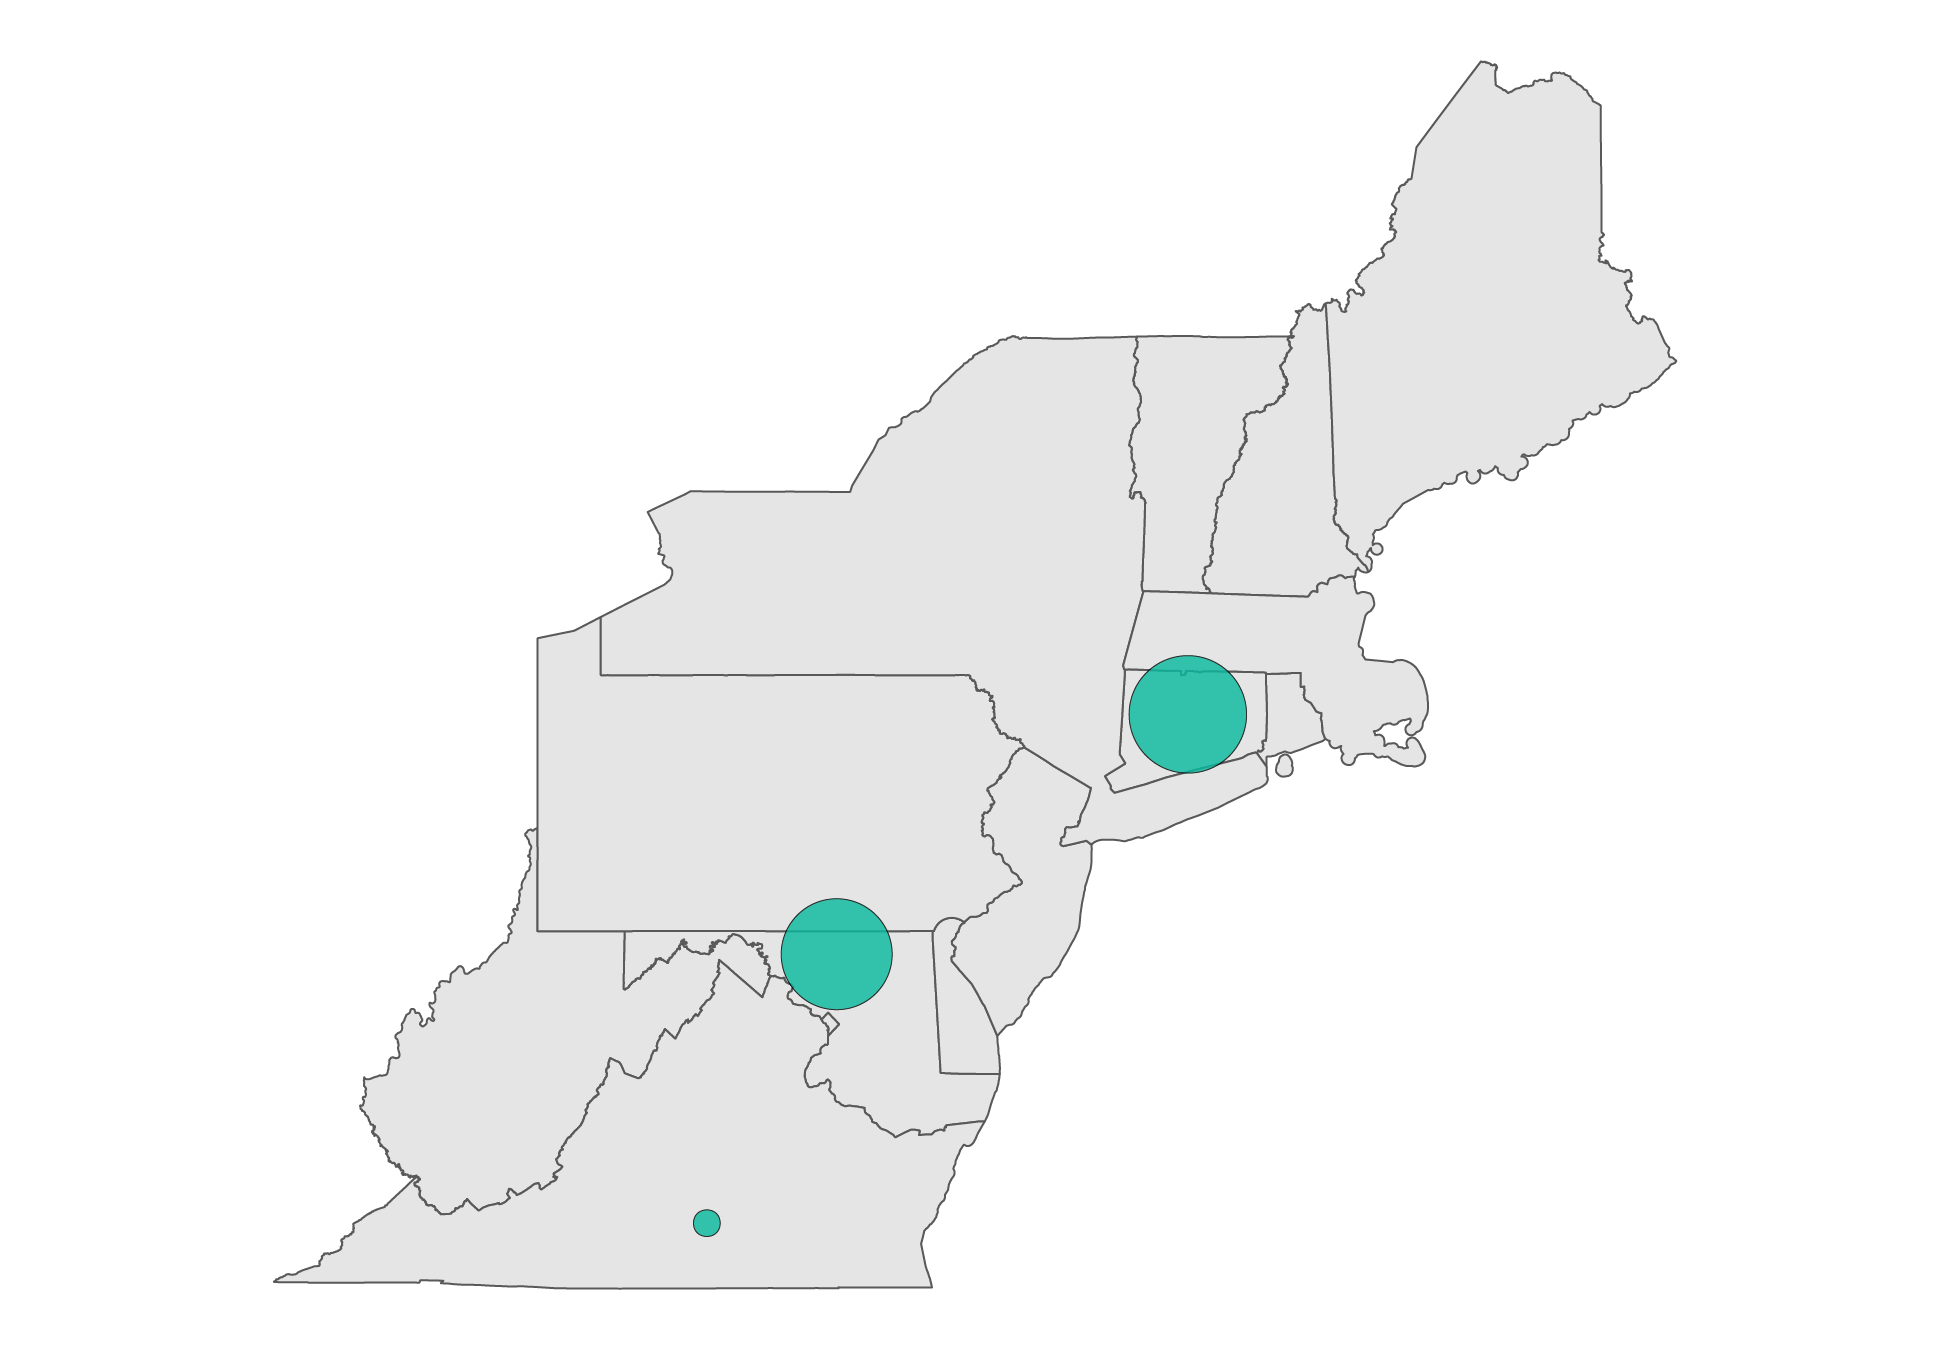
When state funding is taken into account, the disparity between Black and White students shrinks somewhat.

Yet in Connecticut, that disparity actually got worse over a 10-year period.

Professors Preston Green, Bruce Baker, and Joseph Oluwole argue that states should commit to filling the Black/White funding gap as a form of reparations for historic discrimination patterns in housing and education.

"These corrections are past due," they write, "and race neutral alternatives are insufficient."

Source: "School Finance, Race, and Reparations" by Preston Green, Bruce Baker, and Joseph Oluwole. The authors calculated the difference in local property tax revenue between Black and White students using data from the U.S. Census Fiscal Survey of Local Governments. They calculated state aid based on the state's general funding formula. Data on the racial composition of schools came from the National Center for Education Statistics.


Jump to top of page

See more data projects

Created with Scrollama, R, Mapshaper, QGIS, and Illustrator.